
Running a server used to mean guessing
You'd ping the dashboard. The green dot said "Online." You'd close the tab. Hours later, someone on Discord would DM you: "hey, is the server down?" And you'd realize it crashed at 3am and auto-restarted three times in a row.
Two new tabs in the Swelis Control Panel fix that: Observability and Deployments. They turn the question "is my server healthy?" from a guess into a glance.
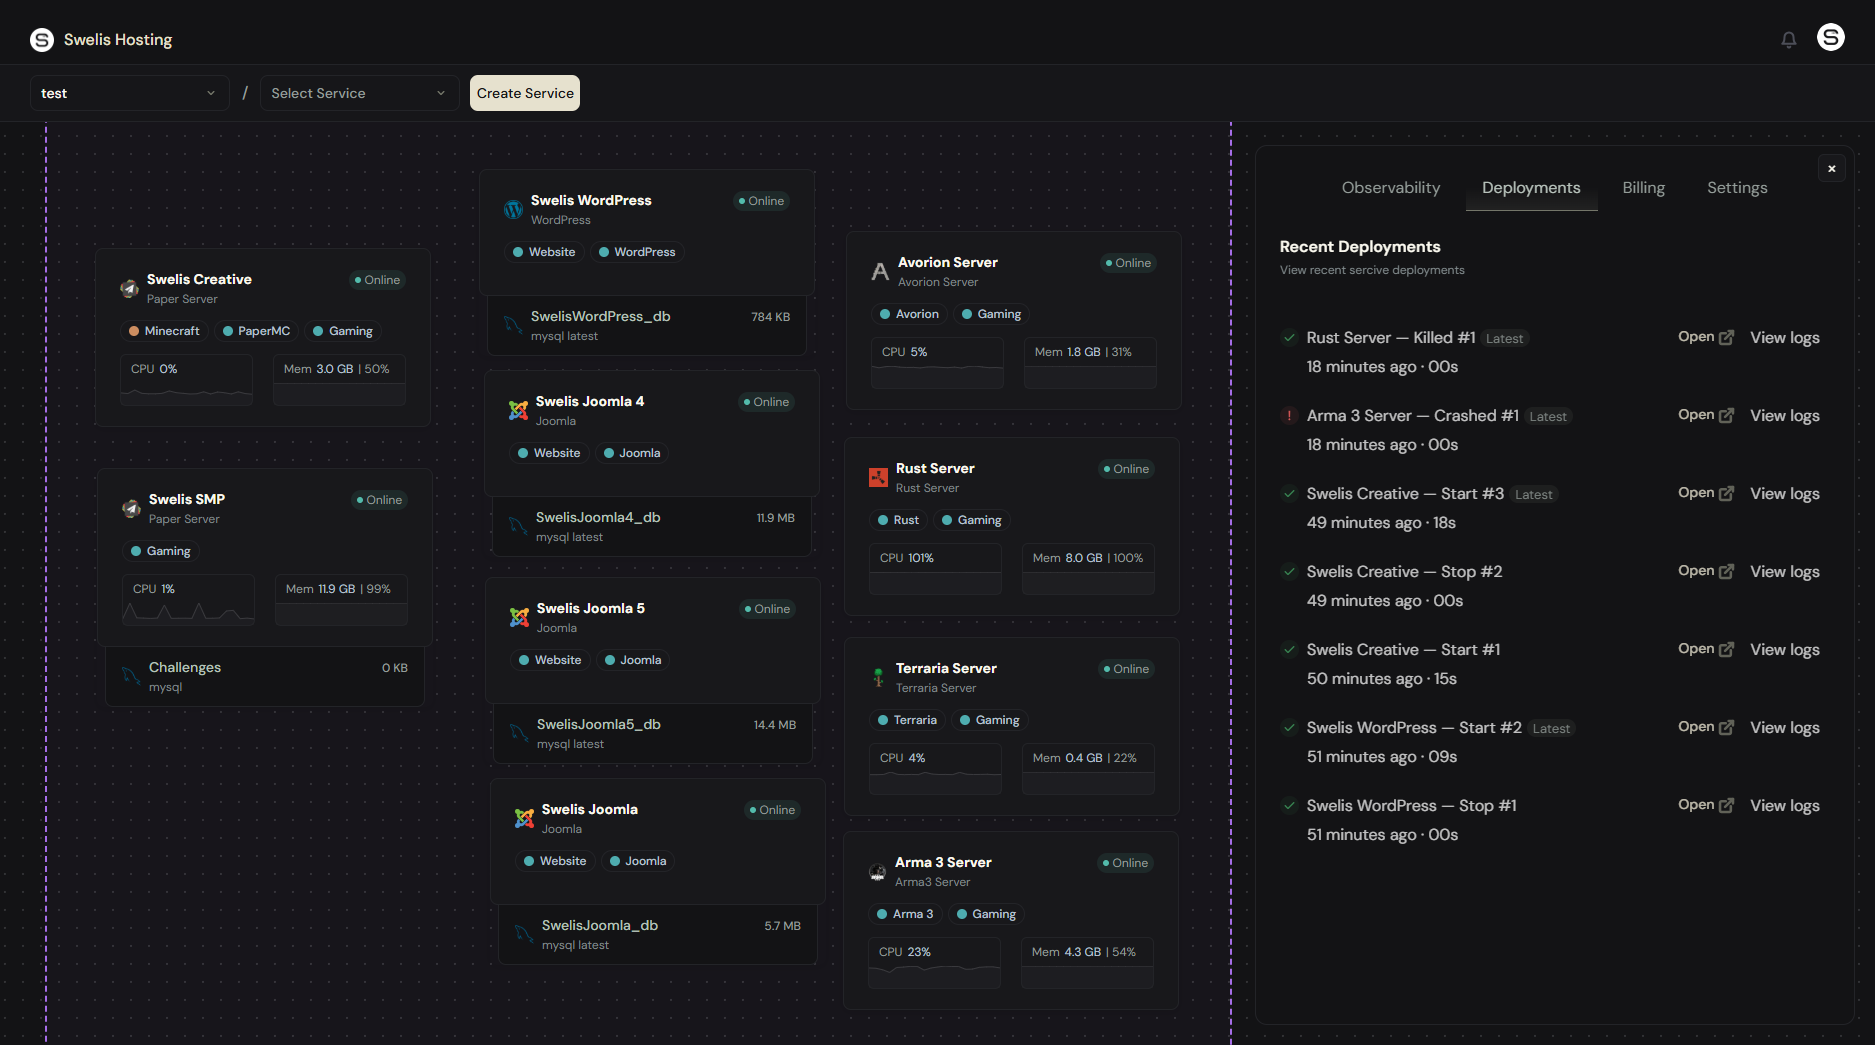
The Deployments Tab
Every time a server starts, stops, restarts, is killed, or crashes — it gets a row.
Each row shows:
- What happened —
Start #42,Crashed #43,Killed #44 - When it happened — relative (
2 hours ago) plus the exact timestamp - How long the action took — startup time in seconds
- Who triggered it — you, a collaborator, or the system
- The latest deployment — tagged with a green "Latest" badge; older rows are dimmed
Click Open on any row and you jump straight into that service's panel — no URL fiddling, no losing your place in the dashboard.
Deployment States
| Badge | Meaning |
|---|---|
| In progress | The action is currently running (server is starting, stopping, etc.) |
| Success | Completed normally |
| Failed | The agent reported an error — hover the row for the message |
| Crashed | Container stopped unexpectedly — no one asked it to |
| Killed | Force-killed via the dashboard or API |
If your server started and then crashed 8 seconds later, you'll see two rows — a Start immediately followed by a Crashed — so you can tell at a glance exactly what happened and when.
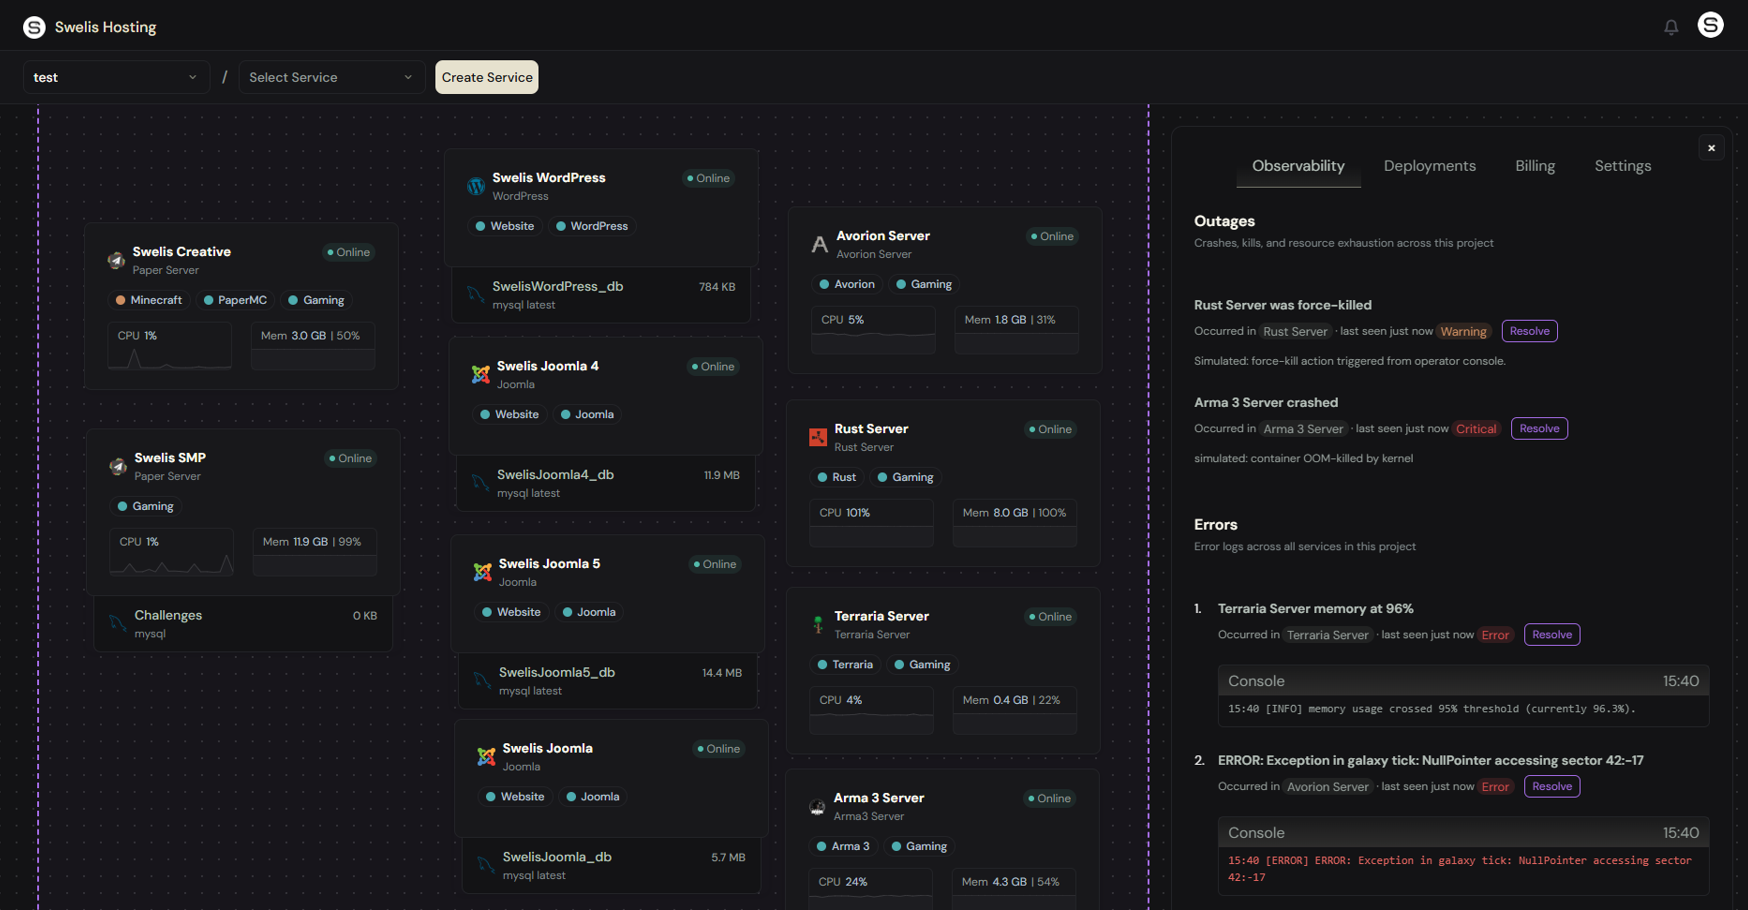
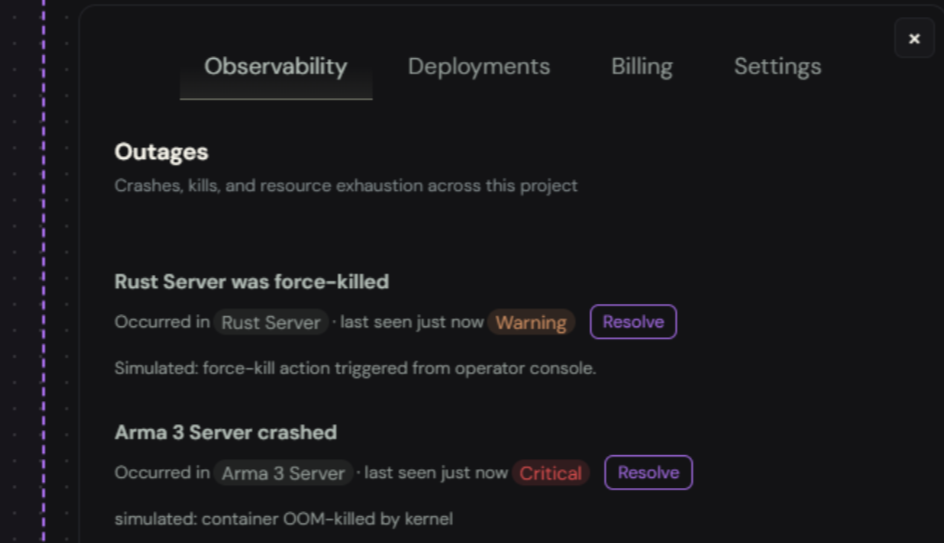
The Observability Tab
If Deployments answers "what happened," Observability answers "what's wrong."
The tab has two sections:
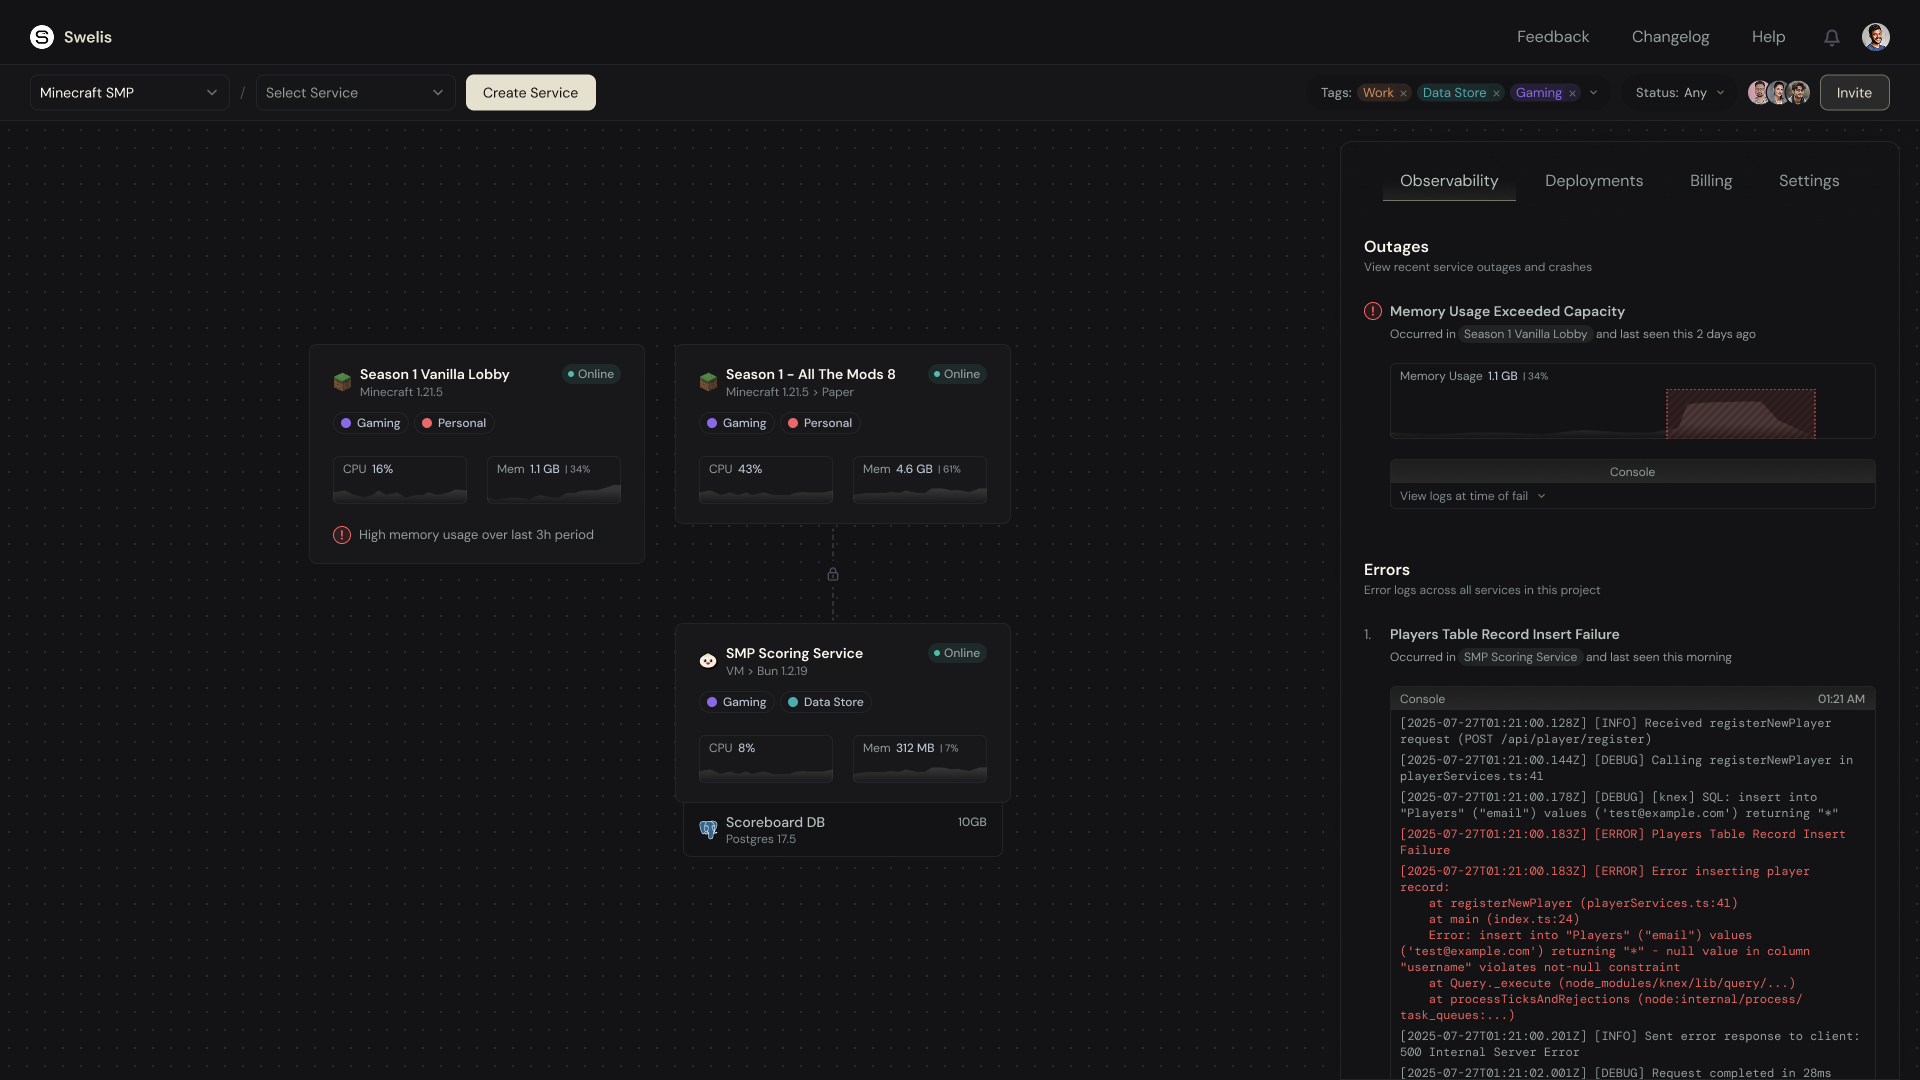
Outages
Anything that takes your server offline or threatens to:
- Crashes — the container exited without being asked to
- Kills — something force-killed it
- Memory exhaustion — RAM crossed 85%, 95%, or 100% of your allocation
- CPU saturation — same thresholds, for CPU
- Disk near-full — disk hit your storage cap
Errors
Log lines the agent saw in your server's output that look like trouble: ERROR, Exception, fatal, uncaught, panic, out of memory, traceback, and more. Each fingerprinted error becomes one row — even if the same error fires 500 times, you see one entry with a ×500 occurrence count.
Event Details
Every event shows:
- Title — what happened, in plain English
- Service tag — click it to jump directly to the affected service
- Last seen — when this event last fired (relative time)
- Severity — Info, Warning, Error, or Critical
- Occurrence count — how many times this exact event has fired
- Resolve button — mark it handled. If it recurs, it auto-reopens with a red badge.
For errors, an embedded console shows the log lines leading up to the problem — no need to open the live console, scroll back, and grep.
Fingerprint Dedup: The Killer Feature
If you've ever used Sentry, you already know why this matters. Without dedup:
Your server crashes 30 times in a loop. Your Observability tab has 30 rows. You have to scroll past 29 of them to find anything else.
With dedup:
Your server crashes 30 times. You see one row, with
×30next to it, and "last seen 2 seconds ago." You know instantly this is a recurring problem, not a one-off.
Each event has a fingerprint — a stable hash of kind + category + resource + normalized-error-signature. Timestamps, memory addresses, UUIDs, IPs, and line numbers are stripped before hashing, so two errors that say:
ERROR at 2026-04-19T10:22:03Z: NullPointer at 0x7ffee4001234
ERROR at 2026-04-19T10:22:07Z: NullPointer at 0x7ffee5990abc
land on the same row instead of two different ones.
Auto-Reopen on Recurrence
Resolved an event last week? If it fires again, Swelis reopens it — so you know the fix didn't stick. No more "oh, I thought we fixed that" discoveries three months later.
Threshold Alerts: Before Things Actually Break
The old way: your server runs out of RAM, gets OOM-killed by the kernel, players get disconnected, you find out tomorrow.
The new way: at 85% memory, a warning event appears. At 95%, it escalates to "error." At 100%, it becomes "critical" — and if your service also hit the storage cap, Swelis will preemptively stop it to prevent data corruption.
All three thresholds use hysteresis — you won't get spammed if usage bounces around 84% and 86%.
Cross-Service, Cross-Type
Observability works for every service type:
- Minecraft (Paper, Vanilla, Forge, Fabric, BungeeCord)
- Avorion, Rust, Terraria, Arma 3, and any future game server
- WordPress and Joomla websites
- Managed PostgreSQL, MongoDB, and MySQL databases
One Observability tab per project, showing events across everything you host. Click a service tag on any event to drill straight into that service.
How It All Works
Behind the scenes:
- Agent scanning — The Swelis agent watches your server's stdout in real time and classifies any line that looks like an error or warning.
- Threshold monitoring — CPU, RAM, and disk usage are sampled continuously. Every bucket crossing is reported.
- Deployment lifecycle hooks — Every start, stop, restart, and kill flows through a tracked deployment row.
- Crash detection heuristic — If your server stops and no one asked it to (no pending deployment exists), it's logged as a crash automatically.
All of this lands in the database with fingerprint dedup, then streams to the dashboard over a short polling interval, so you see changes within seconds.
What's Next
Coming soon:
- Email + webhook notifications for critical events
- Auto-restart on crash toggles per service
- Longer retention and CSV export for incident retrospectives
- Custom alert rules — e.g. "page me if this service crashes more than 3 times in an hour"
TL;DR
Open the Swelis dashboard, pick a project, click Observability — you're now running your servers like a grown-up. No more "is it still up?" pings, no more crash blindspots, no more finding out from your players.